L.E.A.P.
Leaders of Environmental Awareness and Preservation
Hamtramck High School
Clean Sweep 2020 Data
In October 2020, LEAP members went around our community to do clean sweeps. They picked up trash in neighborhoods. On our clean sweeps, we found a lot of gloves and masks. Our members decided to record the data on how many gloves and masks they found in all of the clean sweeps. These graphs show the data. In total, they found 136 masks and 57 gloves.


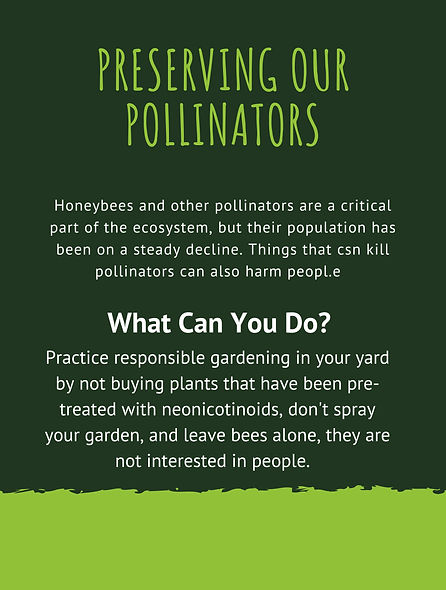
Posters 2021
Since the pandemic began, our club hasn't been able to do our regular projects. For our winter activities, we decided to make posters. Our club members are very diverse and creative. They made posters about a range of topics. They also translated and made the posters into different languages.


Air Quality Data
In October, our members wore air monitors and walked around our city, Hamtramck, to collect data about the air quality. Below is the data they collected over the course of a month. Many parts of our city have very high air pollution levels. Knowing the quality of air people breathe can be life-changing for many. One of the main reasons air quality maps are used is to check what areas to avoid when there are high levels.


This is a wearable air moniter. This monitor collects data and shares it on a phone app. It gives real time information about the air quality.


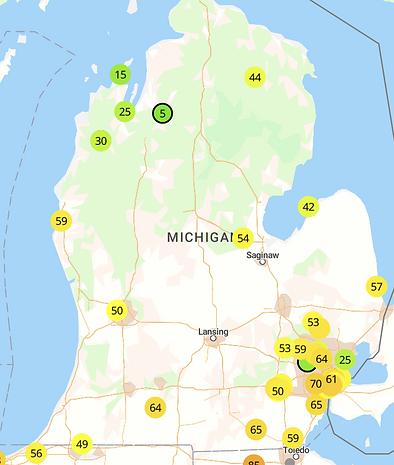


This map shows the air quality in Michigan. The data that's freely available online is collected by air monitors. The data shows that Michigan has fairly safe and moderately polluted air. The data changes from time to time. Most of the polluted air appears to be on the south-eastern regions. You can see more data on this website: https://www.purpleair.com/map